MindMics Hear&Now™
Vital signs monitor app syncs data through earbuds


Client
MindMics
Role
Lead Product Designer
Timeline
July 2020 - July 2021
1
Product owner
(CEO)
1
Product Designer
4
Data Scientists
2
Software Engineers
3
Earbuds Engineers
MY CONTRIBUTION
I was hired as the first and only product designer to create the mobile app while assisting in marketing design efforts. Being a part of a team that understands the importance of good design, I was able to stretch my creative muscles.
My deliverables include mobile app designs, web dashboard explorations, design systems, user research, animations, branding, company website, business deck, social media collateral, and graphs for publications.


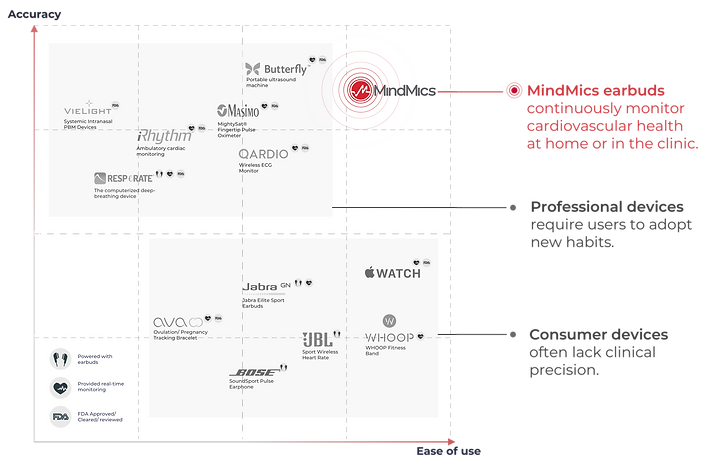
Digital products are the missing components in MindMics.
MindMics earbuds accurately measures vital signs, combining the precision of medical devices and the convenience of customer wearables.
But how can users consume those data? The team decided to build a mobile app and web portal to make information actionable.


Competitive analysis
I created Confluence pages and a Slack channel for the product hunt.
We were constantly looking for new stuff and have researched over 40 products. I then selected Apple Watch, Whoop, Oura Ring, Qardio, and HeartMath for everyday wearing to experience every detail of their designs.
Interviews and personas assumptions
The team used to have regular demo days, so I got lots of fun raw scripts to understand users' expectations. Combing our values and observations, we start to make persona assumptions:
-
People living with health concerns, such as heart diseases
-
People who are interested in monitoring their vital signs.
-
Investors and potential partners.
User journey
Since the pandemic, we've invited over 20 people to our Cambridge office for data collection, interviewing, and testing.


People want to learn their bodies in an easy and actionable way.
The team brainstormed on how can we visualize the data and provide solutions.


Visualize the information architecture using Sitemap


CHALLENGE 1
How could we provide the right amount of data and actionable insights?

SOLUTION 1.1
Dashboard and History
User can scan all of their vital sign data on the dashboard and view collected data in the history view.


My Process
-
Low-fi wireframes
-
Mid-fi wireframe


Earbuds connection status
Real-time vital sign cards
Narrower screen
SOLUTION 1.2
Stress Management and Time Stamp
Whenever the user feels stressed, they can do the breathing exercises in the app and view the real-time bio-feedback.


Create time stamp
My Process
-
Useflows

-
Low-fi explorations


CHALLENGE 2
How could we reveal the beauty of data and help users interpret it?
SOLUTION 2.1
Heart Rate Data Visualization
Users can get insights from historical data and notes by sifting through different time windows.
Combines with the timestamps created, users can recall events that are worth their attention.

My Process
-
Low-fi wireframes
-
High-fi explorations


Time window selector
Highlighted values
Activity and note history
Main data vis Learn more
Vital sign tabs
Average value

SOLUTION 2.2
Blood Pressure Data Visualization
Users can view their Blood Pressure data with the personalized range and identify any abnormal patterns.
Below is the data visualization design for Respiratory Rate:

My Process
-
Low-fi wireframes
-
High-fi explorations


Time window selector
Systolic values
Diastolic values
Main data vis Learn more
Blood pressure
logs
Blood pressure range


We got a chance to team with AARP and test the earbuds and the mobile app with real end-users
We recruited 10 participants for 4-day in-home testing and selected 3 for follow-up interviews. I designed the screening criteria, instructions, tasks, and survey questions for the testing.
Tester onboarding


4 day in home testing


Follow up interviews


RESULT 1
All testers find it easy to locate testable features.
In general, the testing results are very positive. Yet they have high expectations of getting a personalized experience.
RESULT 2
8 out of 9 testers have trouble getting the signals at least once
After sharing the finding with the team, we decided to add a signal testing step in the onboarding to guide users to test the signal and find the best earbuds fit.


RESULT 3
6 out 9 testers only put on the earbuds for daily tasks
We found that users won't be wearing the earbuds 24/7; they use the earbuds as a health monitor device and use them for specific use cases.
We then start exploring the limit data states for the data visualizations (see below) and other use cases, such as morning check-ins or exercise tracking.


I built the design system from the scratch
I wrote the specifications and used Zeplin to deliver designs with developers.


The app launched on TestFlight in 2021. Since then, we:
-
have been selected on MassChallenge's final list.
-
teamed with AARP and conducted in-home user testing.
-
cooperated with Prisma Health for clinical trials data collection and app testing.
-
partnered with Logitech to explore the use case with Esport athletes.
-
connected with Facebook for further opportunities.
-
...